


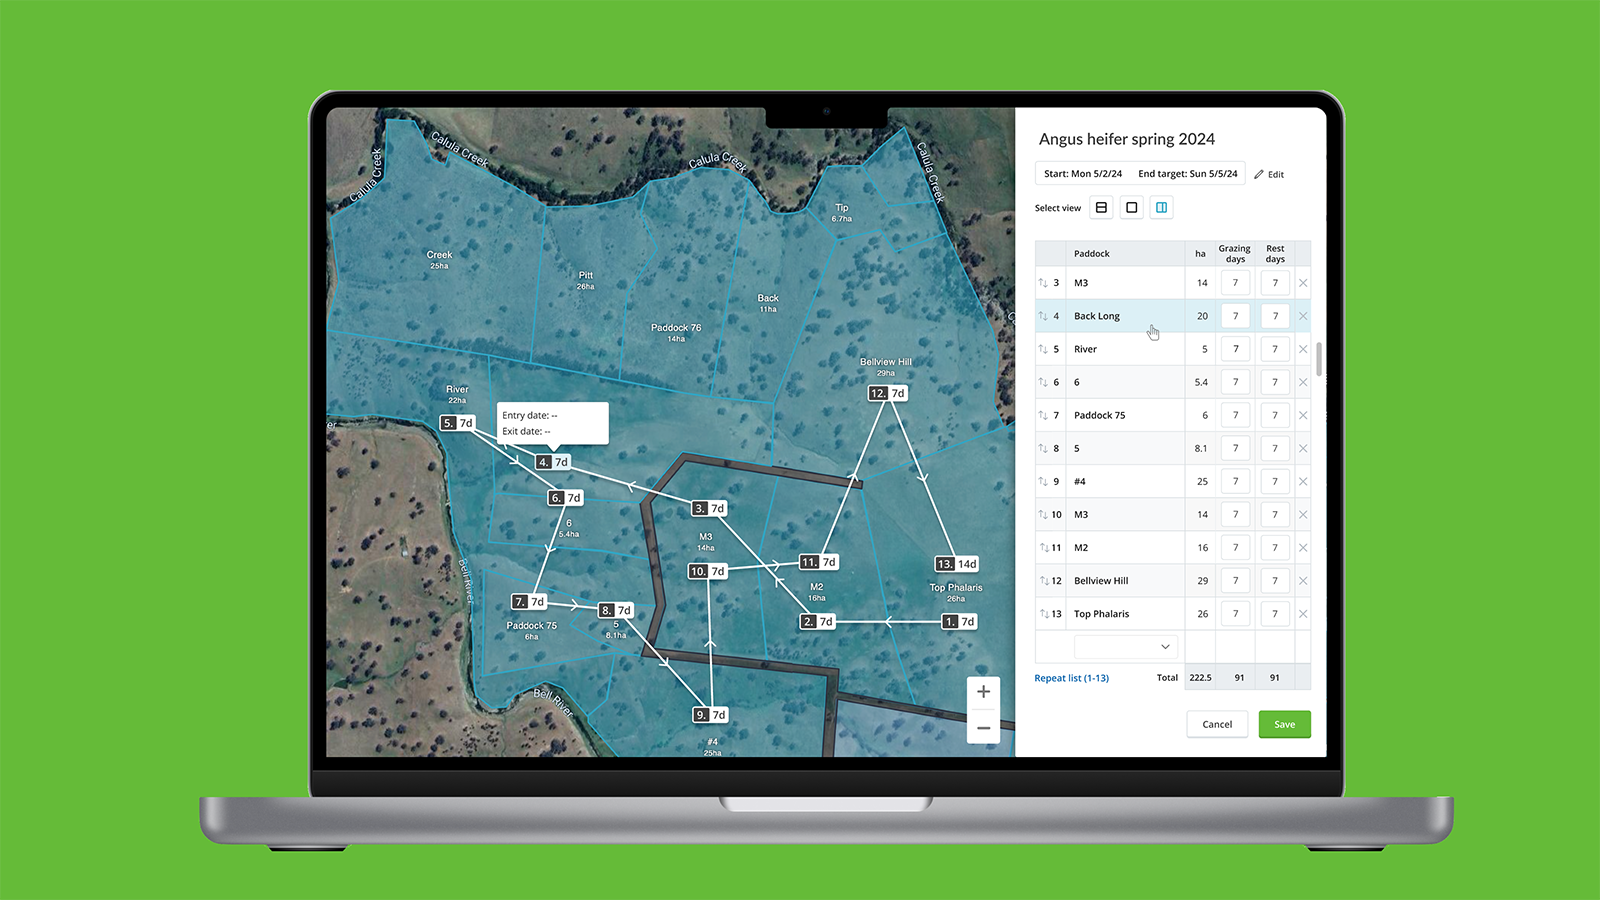
I led the design of AgriWebb's Grazing planner from the ground up – turning whiteboards and paper grazing charts into a tool that adapts as plans change on the farm, and later extended it to support cell grazing.
with Jess Shipp, Zoe Bartley & Tom Legge
Section 01 – The challenge
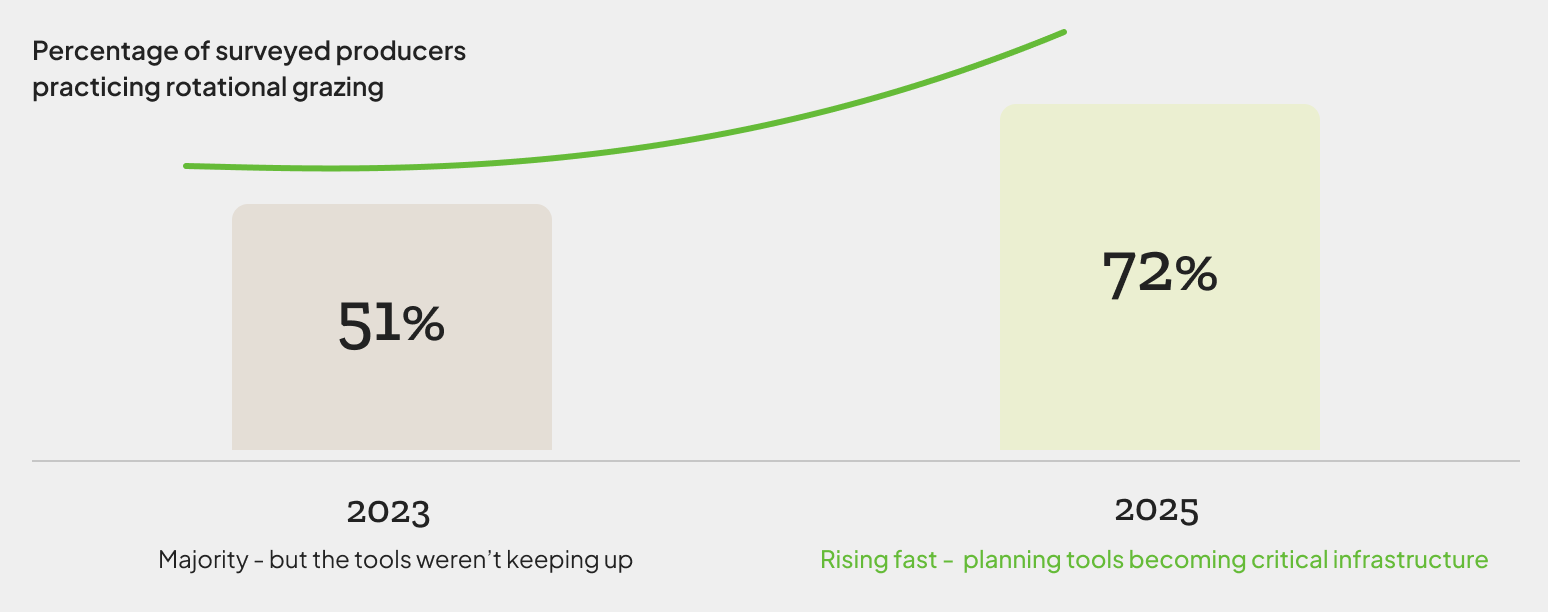
As rotational grazing grows for its sustainability benefits, AgriWebb built tools to make these pasture management strategies easier to execute.
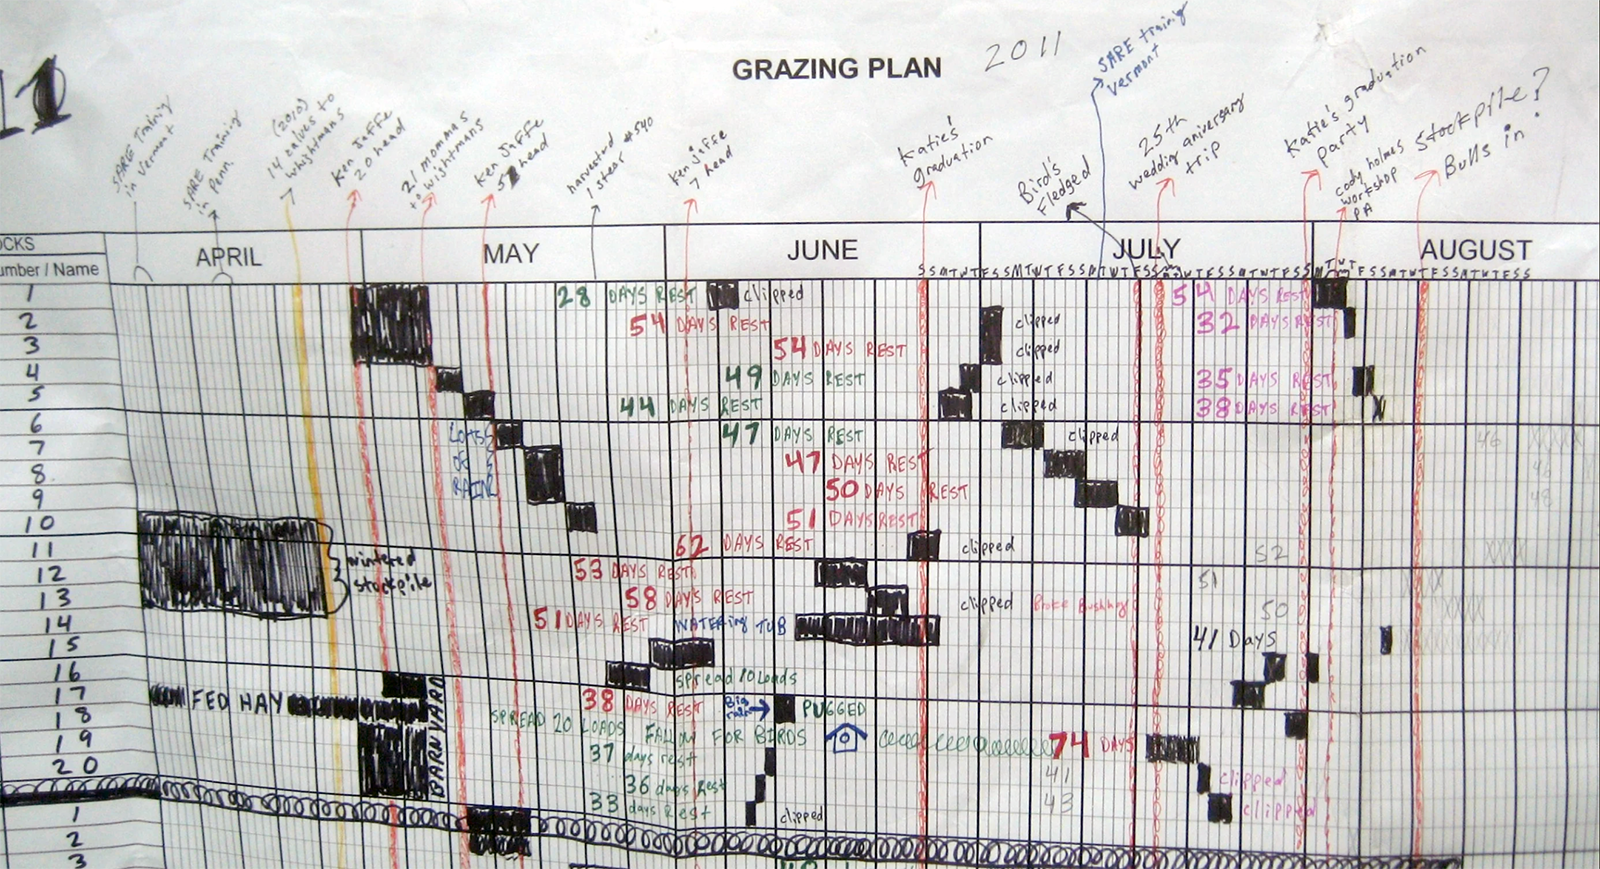
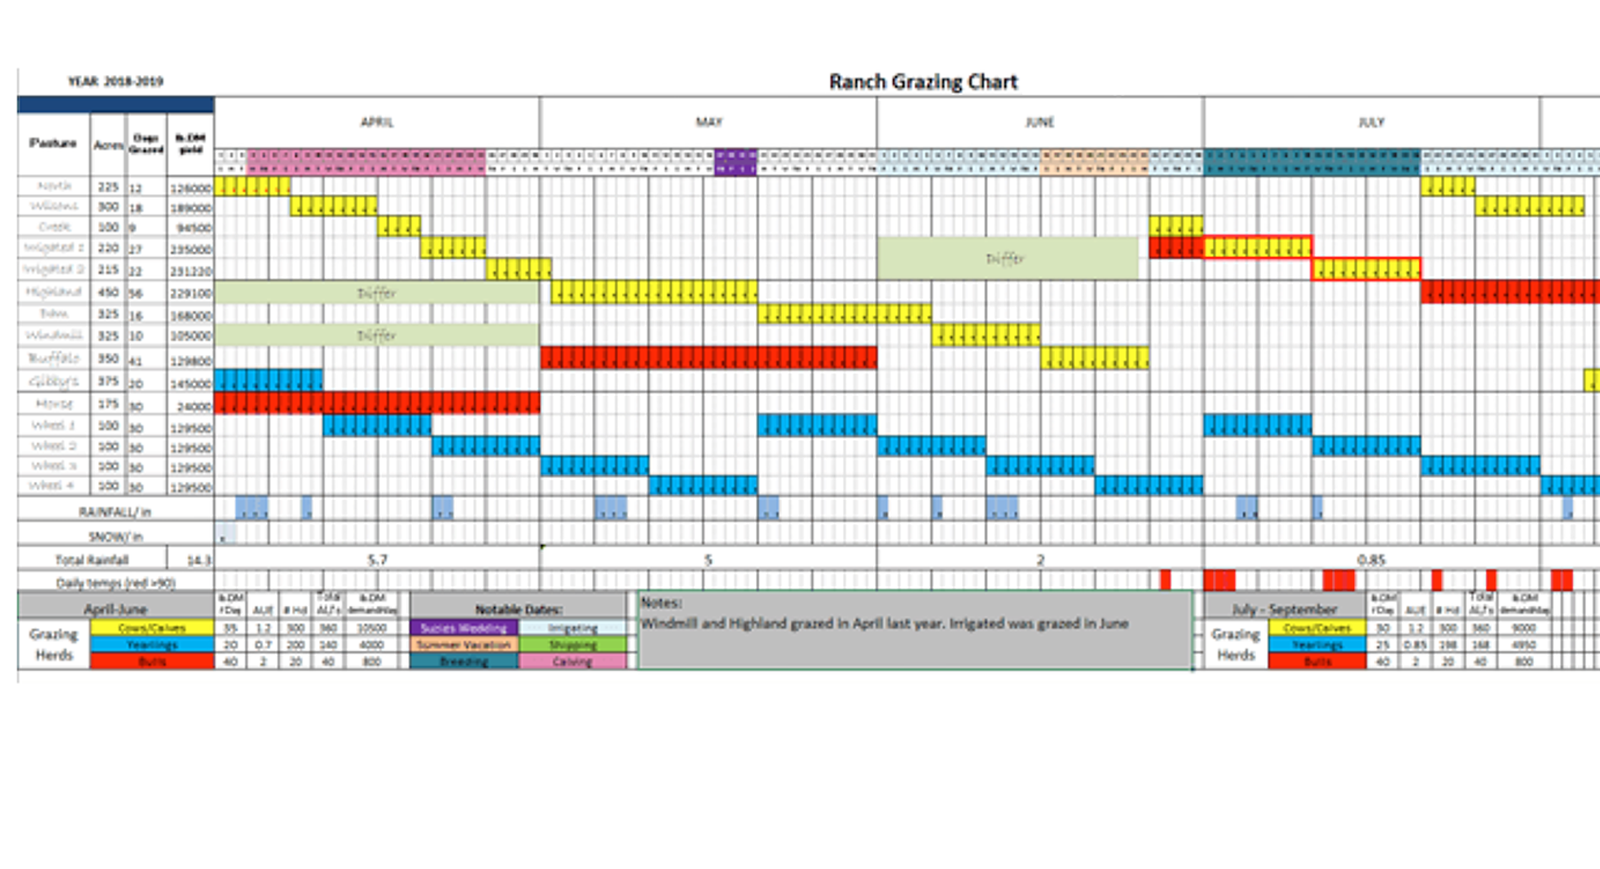
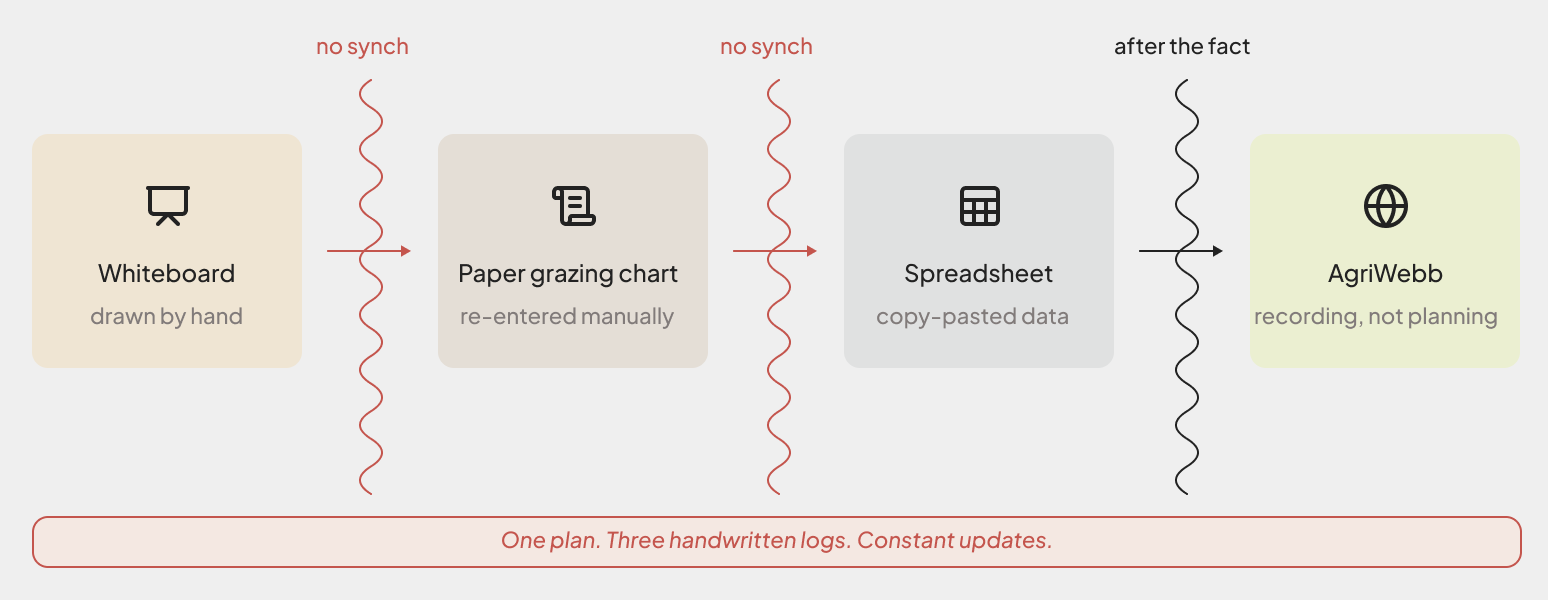
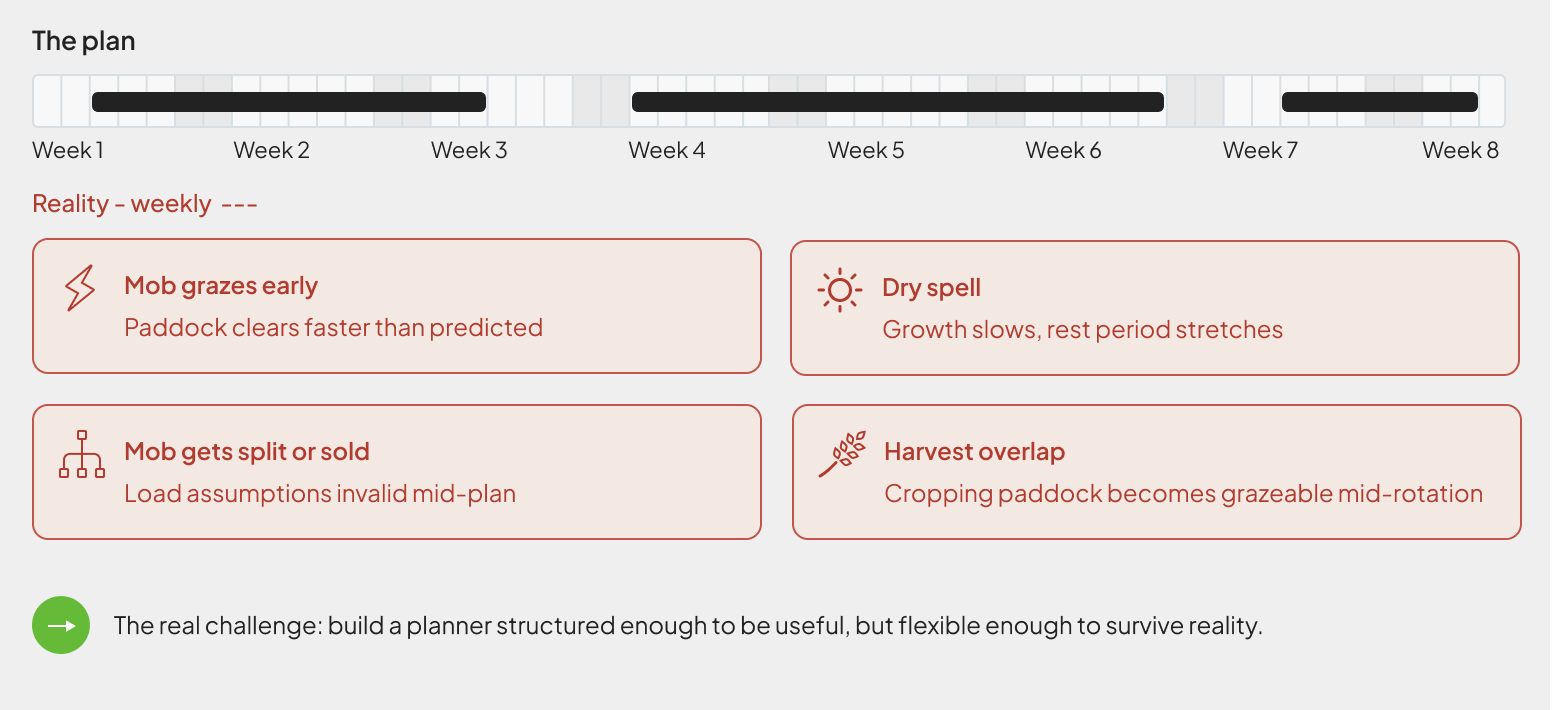
AgriWebb tracked where livestock had been, but lacked tools to guide where they should go next. Grazing plans are constant estimates challenged by everyday farm realities. The real design challenge was building a planner structured enough to guide, yet flexible enough to adapt.
Section 02 – The process
Starting point
Built on competitive insights and validated by producers, the design directly reflects how farmers plan.
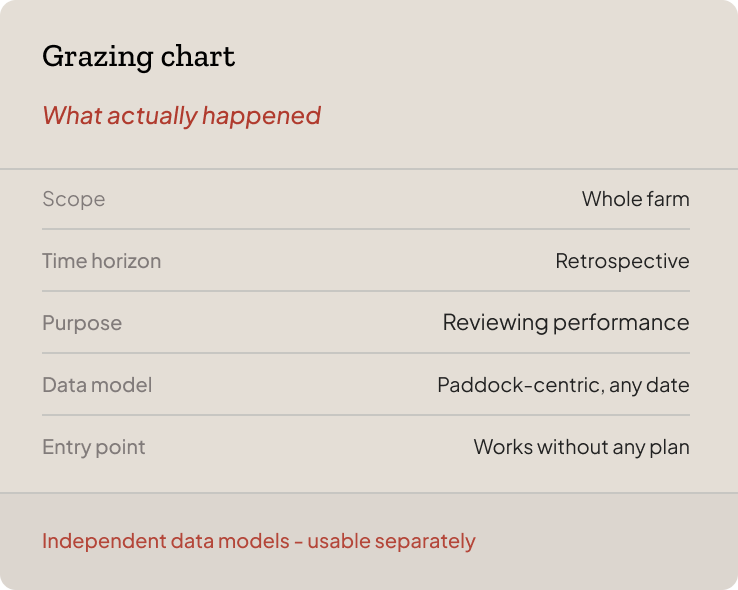
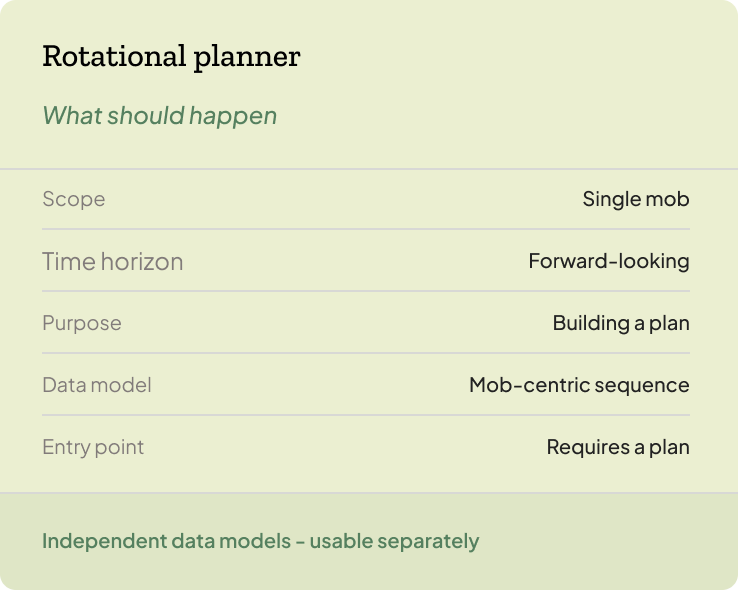
Two tools, not one view
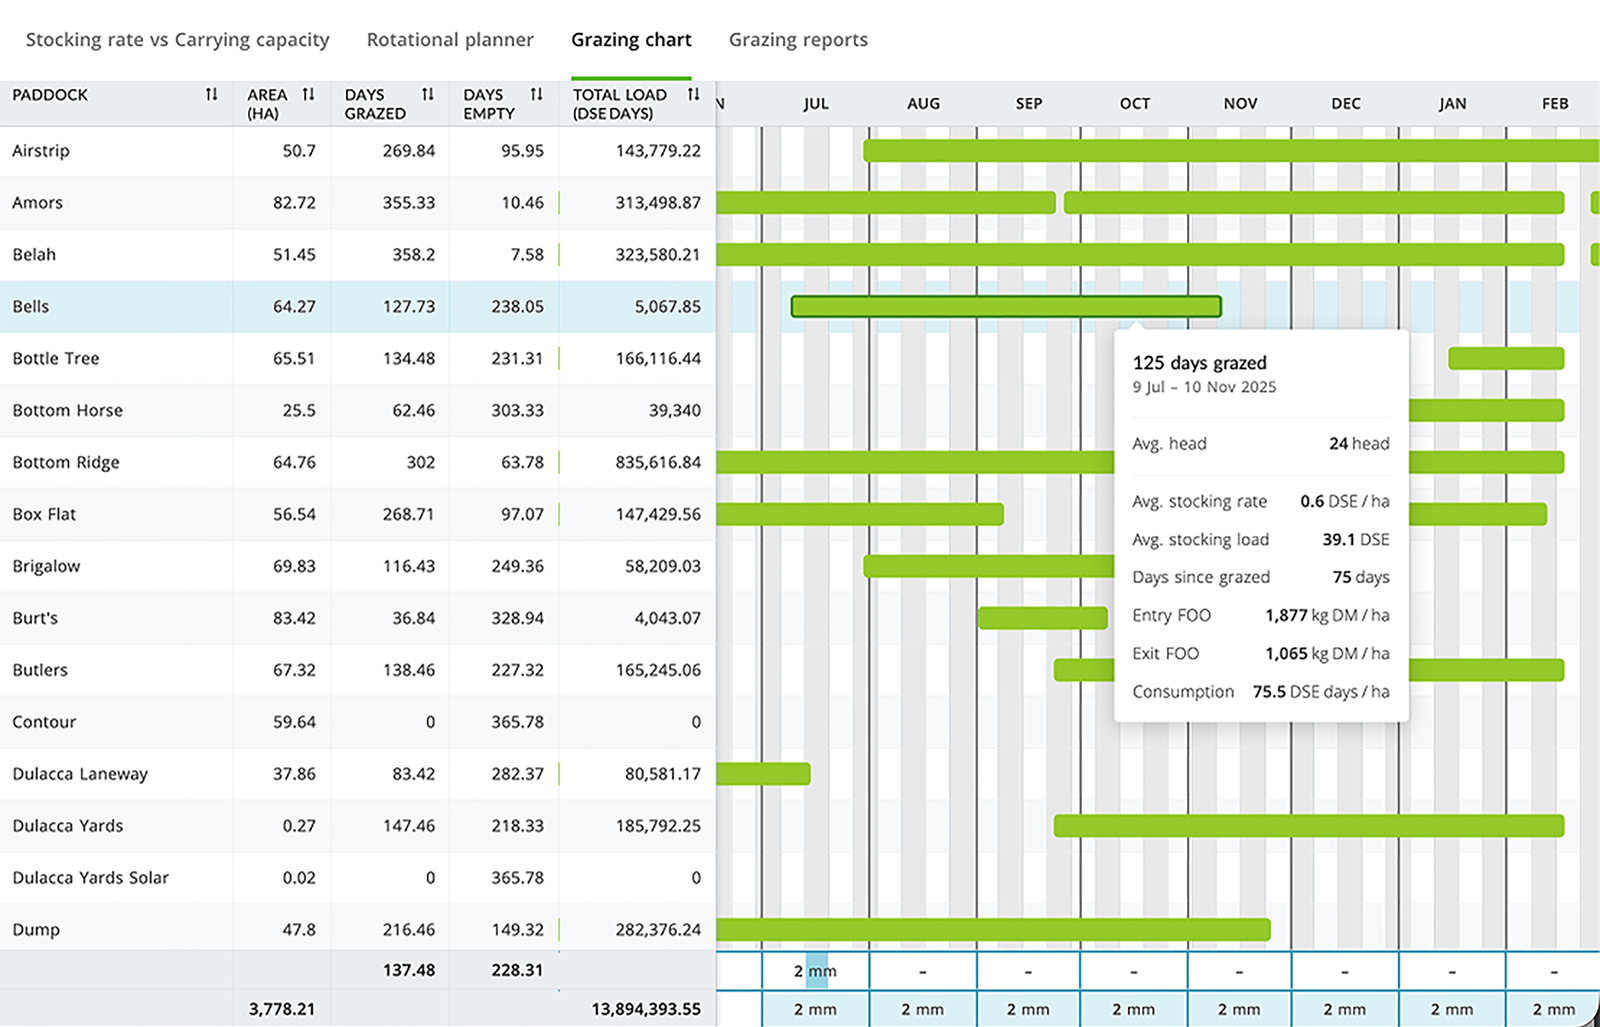
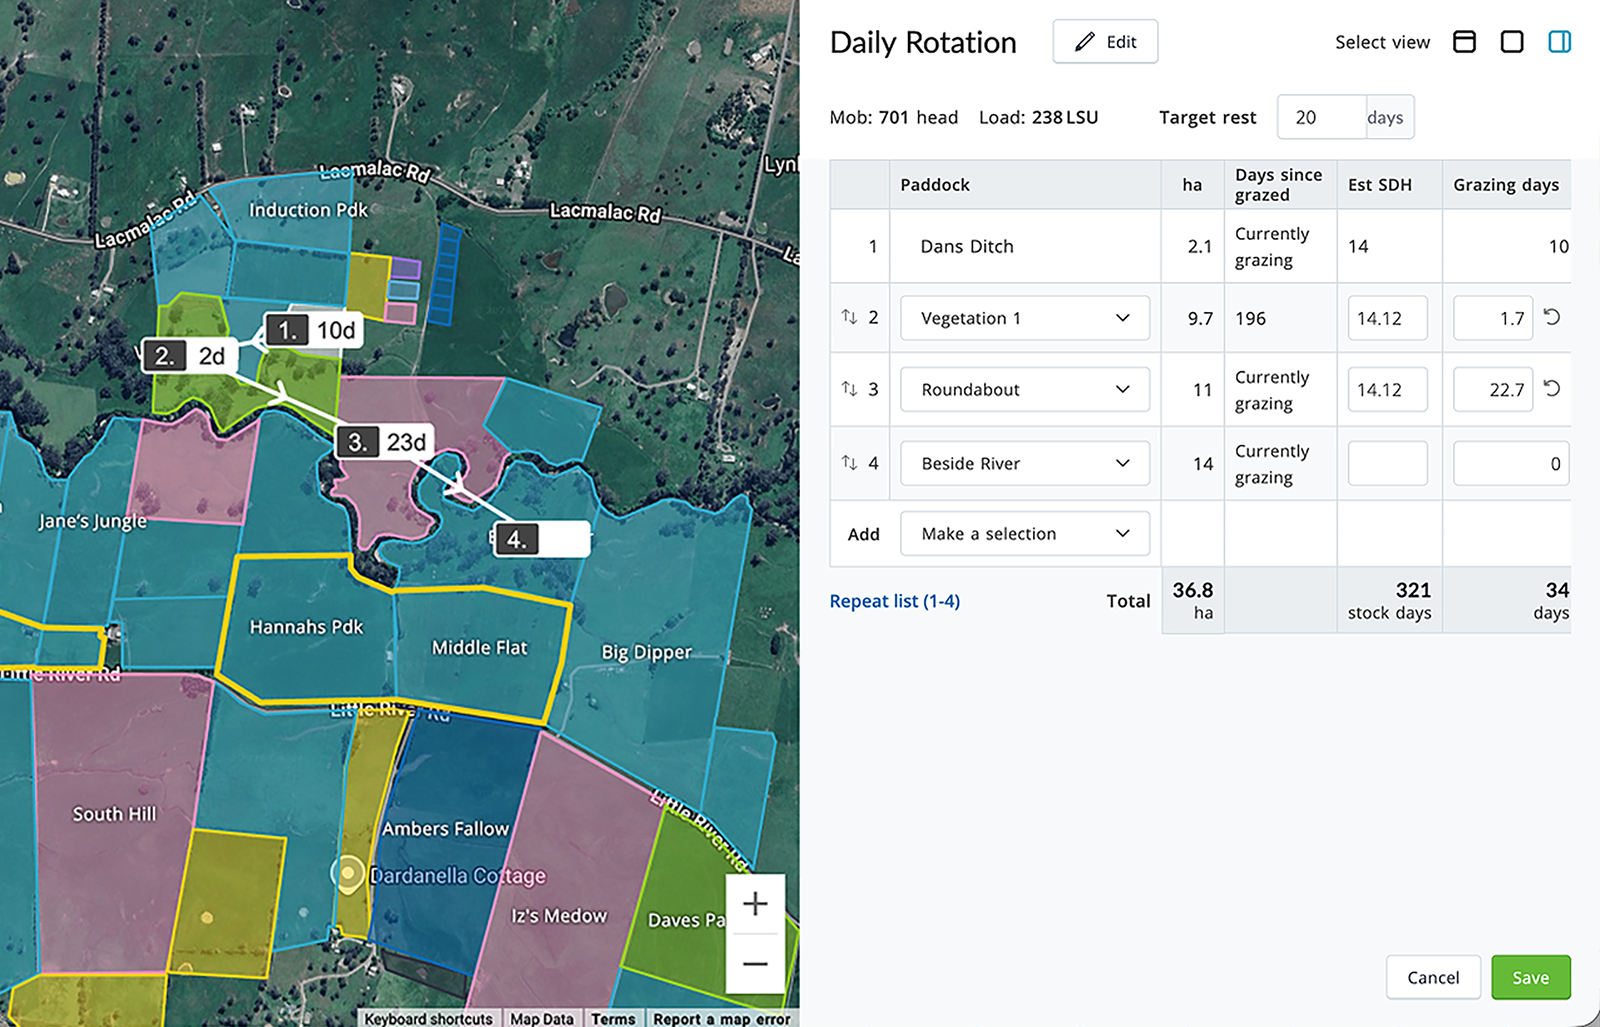
The product splits into two dedicated tools tailored to different workflows: forward planning and historical performance review.
Designing for a plan that changes
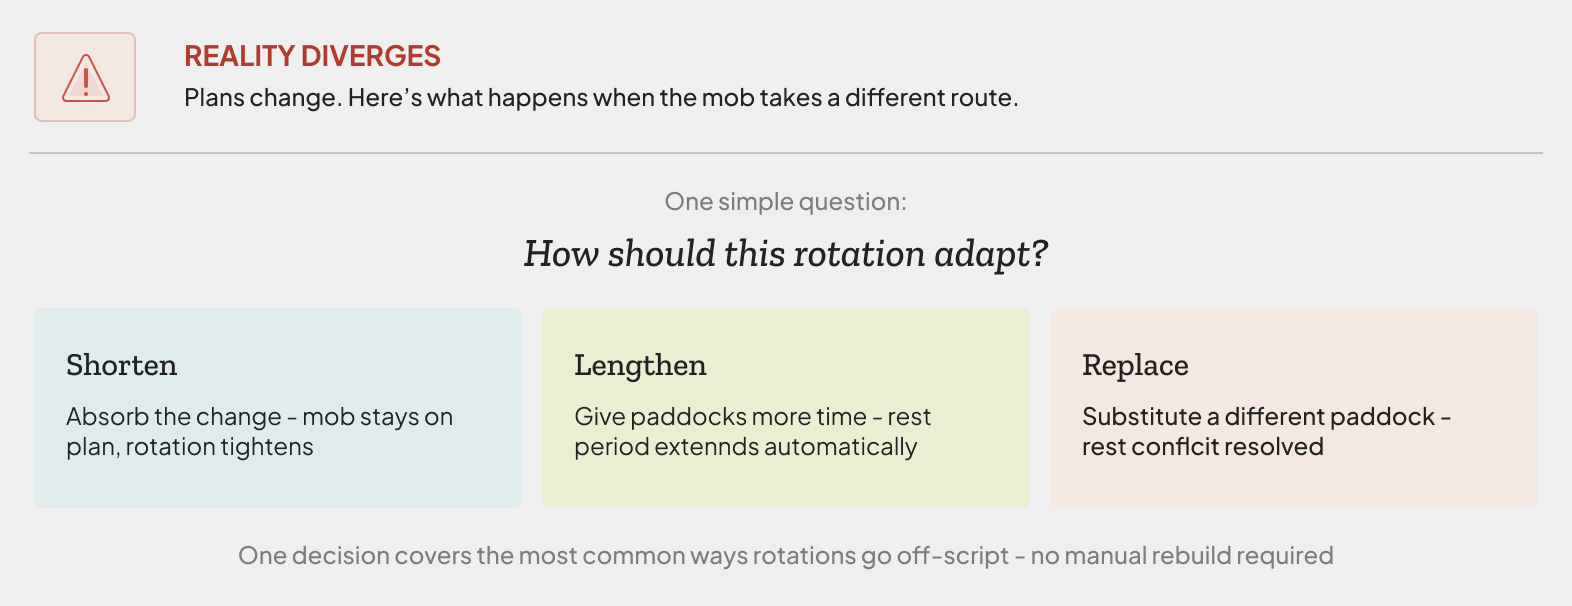
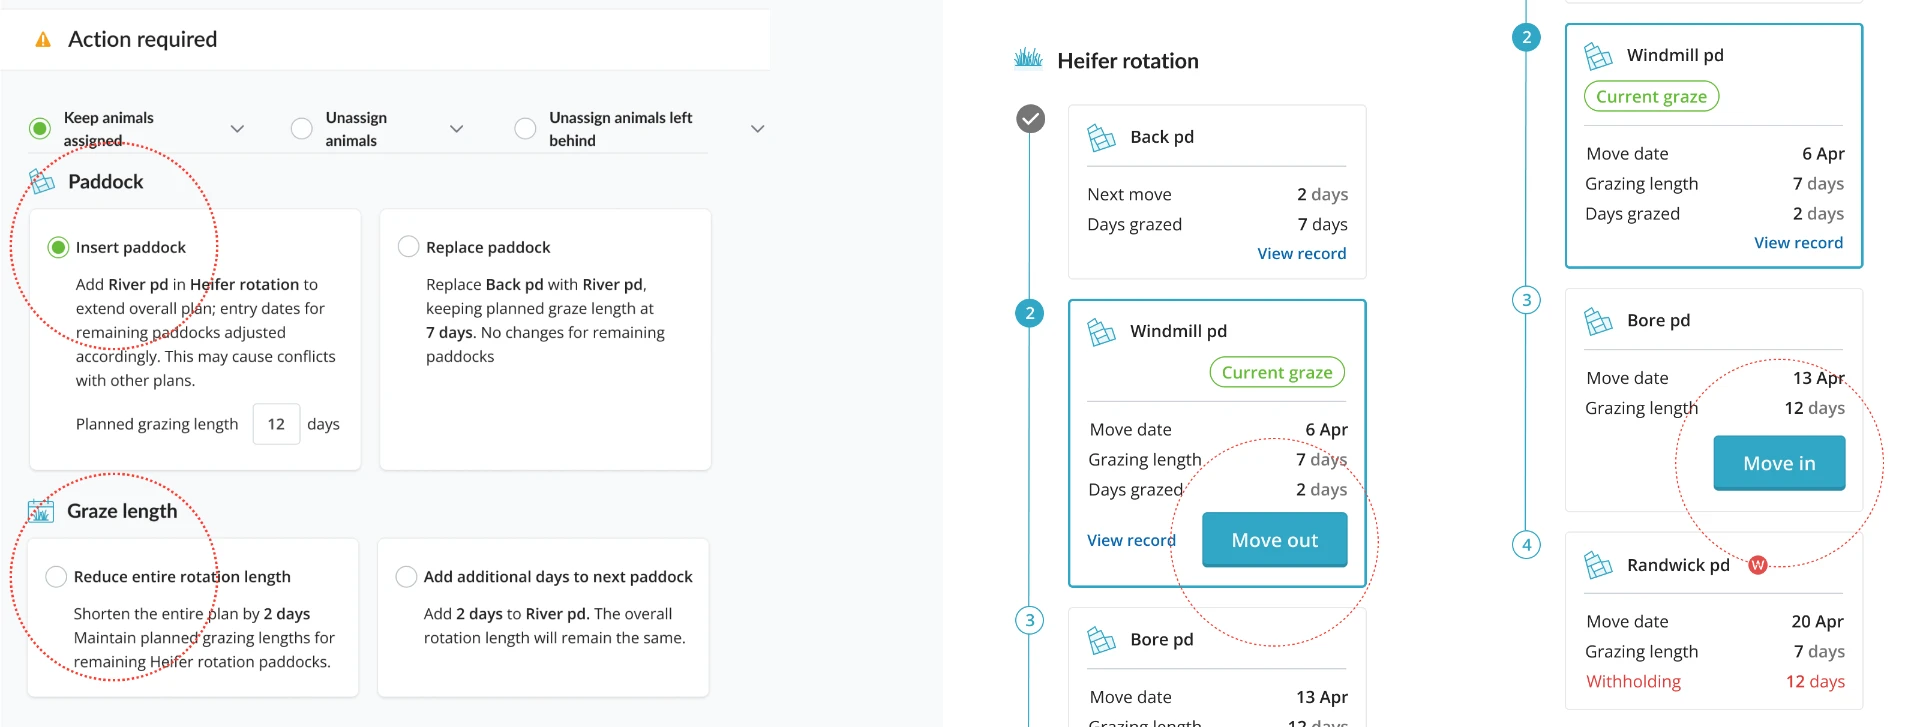
I designed the rotation to adapt: conflicts flag without blocking saves, and off-script moves prompt simple adjustments without forcing complete plan rebuilds.
Section 03 – Outcome & impact
My grazing planner has become more than a production and decision-making tool: it is my diary of life.
The bigger picture
“Day one was ‘where are my animals.’ It then led to compliance… The direction now is where – looking at what's happening in advance. And that starts with planning – here's your grazing plan, here's your enterprise plan.”
- 345
- Farms
- 1090
- Rotations
- 64%
- Ranked #1
- 5/5
- Ease of use
Used Movement & Grazing plans
Created and tracked
Grazing planning for cost & efficiency (AU)
Beta tester rating
Source: AgriWebb State of the Farmer Report, 2025
345 farms created 1,090 rotations – tracked from setup through to active, exited early, and complete. Producers ranked grazing planning the single most impactful AgTech category for cost and efficiency, ahead of every other category surveyed.
“Last time it had to be very exact. The takeaway from that project is everything has to be connected – you can change on the fly.”

345 farms using Grazing plans
By June 2025
1,090 rotations created
Setup → active → complete
#1 AgTech for cost & efficiency
AU 64% · US 61.5% – State of the Farmer 2025
Backed by Foragecaster research
$7.5M · 22M animals · 18,000 producers
5/5 ease of use
Direct beta tester rating
Grazing Chart – prescriptive guidance
Stayed descriptive in V1
Conflict-flagging color logic
Red misread as error state
“Move” button dual-purpose confusion
Record vs. edit ambiguity
Build rotation directly on map
Requested by every producer tested – roadmap